
Skip to content
Food waste tracking for commercial kitchens

Food is being wasted every day.See where it happens, why it happens and what it could be costing you.

Crumbz is a mobile food-waste tracking and action system. Staff record discarded food using phones already in the kitchen. Managers see what was wasted, where, why and what should change.

  • No fixed hardware purchase
  • No payment
  • No commitment
  • Start with one kitchen
Buffet return · 14:22 Scanned
Photograph captured
Suggested item
Basmati rice
Quantity
2–4 kg
Reason
Overproduction
Management evidence
Illustrative data
Estimated waste cost · 36 days
AED 7,840 repeated
Top waste item
Basmati rice
Highest-loss station
Buffet return
Most common reason
Overproduction
Data Confidence
82%
Workflow
  1. Scan
  2. Photograph
  3. Confirm
  4. Improve

Designed for modern commercial kitchens

  • Hotels and resorts
  • Restaurant groups
  • Contract catering
  • Central kitchens
  • Prepared-food retail
Strategic positioning

Inventory tells you what was bought.
Crumbz shows what was physically discarded.

36
days free
1
kitchen to start
0
fixed hardware
The visibility gap

Most kitchens can see food cost. They cannot see the physical waste behind it.

Crumbz sits between what was purchased and what left the kitchen — recording the physical events that a P&L can only summarise.

  1. 01

    What is being wasted?

    Prep loss, buffet returns, spoilage, expiry, plate waste and unsold food are frequently mixed together.

  2. 02

    Where does it happen?

    Cold rooms, preparation stations, bakery, buffet, dispatch and plate-return areas create different forms of loss.

  3. 03

    Why does it happen?

    Overproduction, incorrect batch sizes, poor refill timing, weak ordering cycles, spoilage and portion problems require different actions.

Waste does not happen in one place

Follow the loss across the kitchen.

  • Chef trimming fresh herbs on a wooden board in a premium commercial kitchen
    01 / 04

    Preparation waste

    Record trim loss, batch errors and over-preparation where production begins.
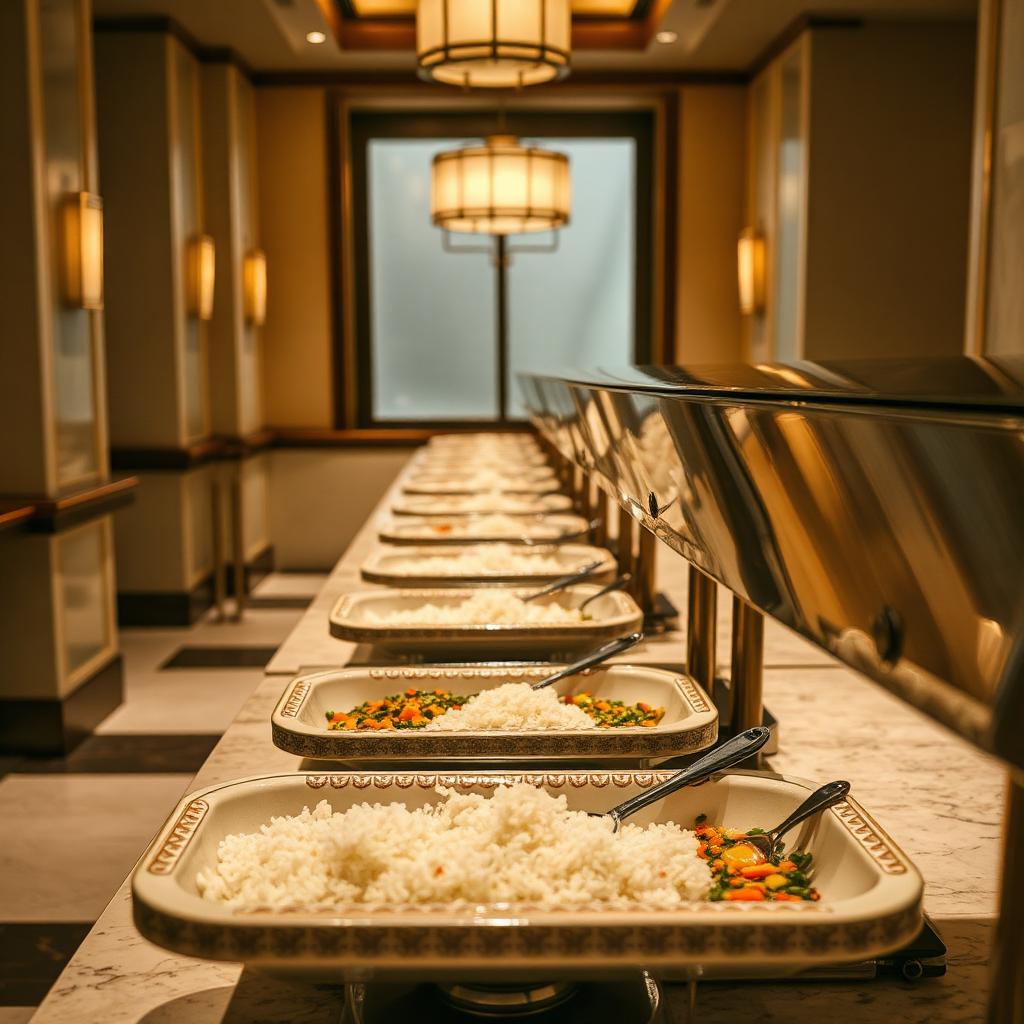
  • Elegant hotel buffet line with warm chafing dishes at end of service
    02 / 04

    Buffet surplus

    See which dishes repeatedly return after service and whether refill timing is creating loss.
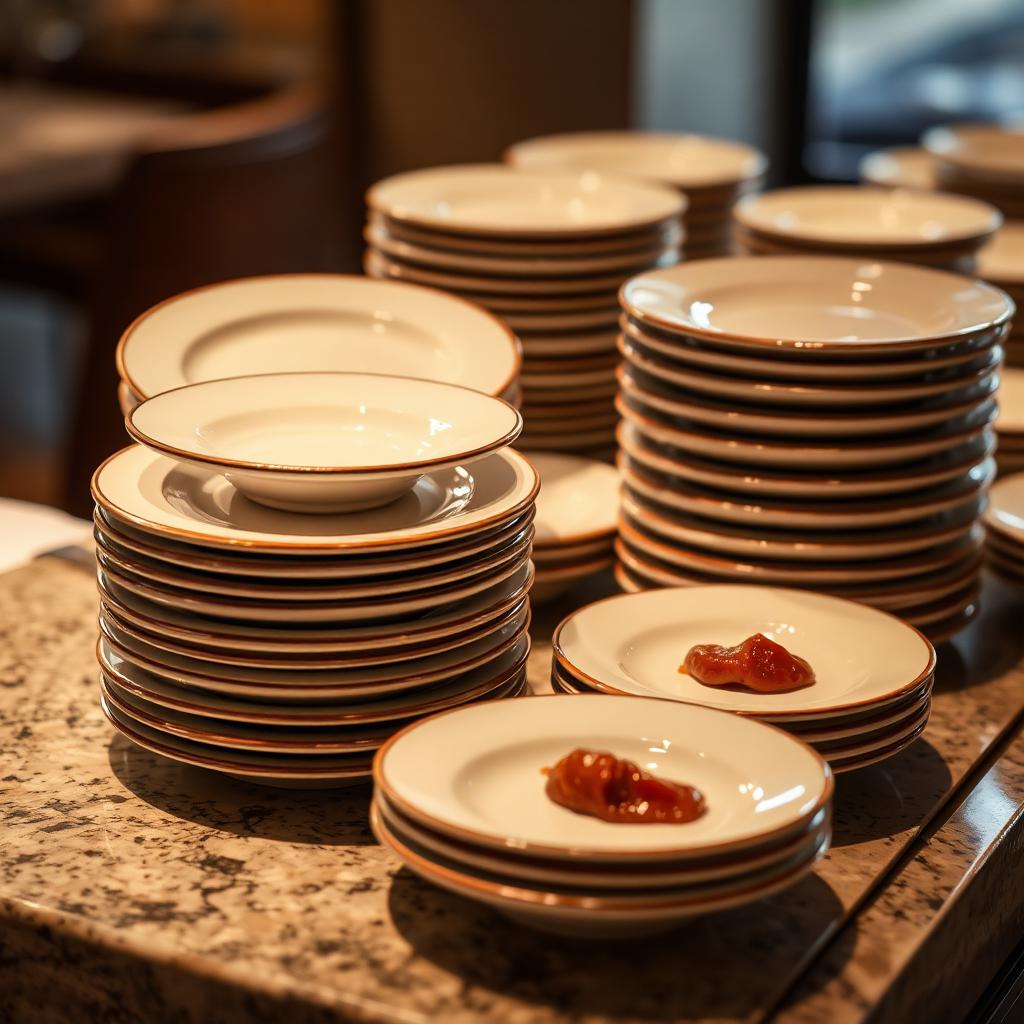
  • Stacked ceramic restaurant plates with small remaining portions
    03 / 04

    Plate return

    Identify repeated leftovers that may point to portion, recipe, quality or menu issues.
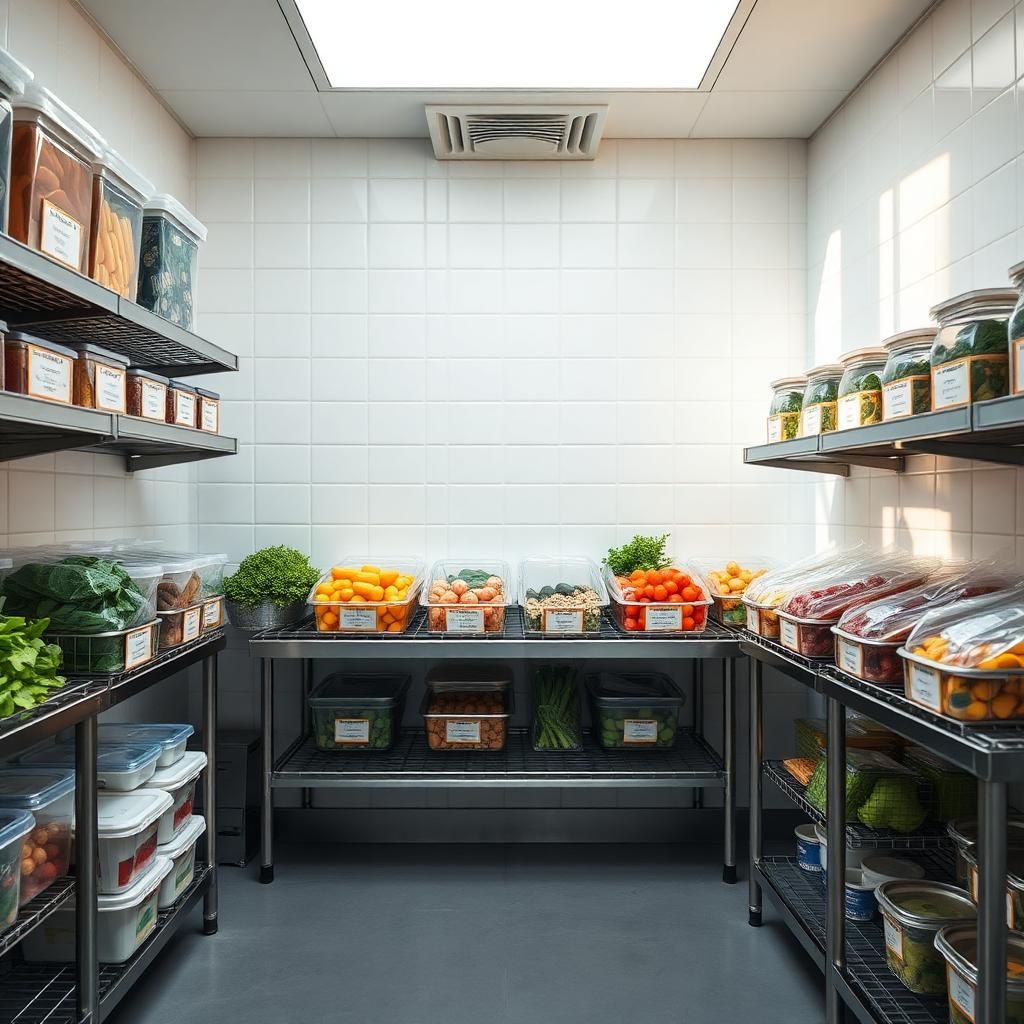
  • Organized commercial kitchen cold room with labeled fresh produce containers
    04 / 04

    Expiry & spoilage

    Connect repeated stock loss to ordering frequency, shelf life and storage discipline.

Scroll horizontally to move through the kitchen →

A short operating habit

Scan. Photograph. Confirm. Improve.

A simple capture process turns discarded food into management evidence without interrupting kitchen operations.

Waste station · Buffet return01/04
Scan

Open the QR code at the relevant waste station.

Item
Basmati rice
Qty
2–4 kg
Built for operations, not surveillance

Improve the kitchen without scoring employees.

  • No employee scoring

    Crumbz identifies food-waste patterns. It does not rank individual staff.

  • Station-level visibility

    Reports focus on food item, station, service period and reason.

  • Management access

    Operational reports are intended for authorised management roles.

  • Controlled kitchen data

    Food images are used to understand waste events, not to evaluate employee performance.

  • Human confirmation

    Staff confirm captured information before it becomes part of the operational dataset.

Your 36-day output

A report management can act on.

Illustrative data
36-day management summary
Kitchen: The Harbour Restaurant
Estimated waste cost
AED 7,840
Top waste item
Basmati rice
Highest-loss station
Buffet return
Most common reason
Overproduction
Data Confidence
82%
  • Cost visibility

    Estimated waste cost by food item, waste station, service period, reason and day.

  • Repeated patterns

    Identify high-frequency and high-value waste management should prioritise.

  • Station comparison

    Compare waste across buffet return, preparation, plate return, cold storage, bakery and dispatch.

  • Reason analysis

    Separate overproduction, unsold food, plate return, expiry, spoilage, production error and quality issue.

  • Data Confidence

    Influenced by capture coverage, image quality, confirmation consistency, missing reasons, corrections and station coverage.

  • Action sheet

    Turn findings into one specific action, an assigned owner, a review period and before-and-after evidence.

Dashboard preview · 01 / 06
Estimated waste cost
AED 7,840Estimated waste cost · 36 days
Mon
Tue
Wed
Thu
Fri
Sat
Sun

The complete report is created from your own kitchen data during the 36-day experience.

Register and experience Crumbz
36.
days

Why 36 days?

Thirty-six days provides enough time to establish the capture habit, observe repeated weekly patterns and test at least one practical operating action.

What happens during the experience

A defined kitchen pilot, not an open-ended software trial.

  1. 01
    Day 1

    Map the kitchen

    Confirm one site, identify the relevant waste points and position the QR stations.

  2. 02
    Days 2–7

    Build the habit

    Staff use the short scan, photograph and confirm process during normal operations.

  3. 03
    Day 14

    Review the baseline

    Management sees the first usable items, stations and reasons behind repeated waste.

  4. 04
    Day 36

    Receive the action report

    Review estimated cost, Data Confidence, primary waste drivers and the next action to test.

What the evidence can improve

Better decisions where waste begins.

−18%
buffet rice refills (illustrative)

Prepare better

Adjust batch sizes, production timing, buffet refill quantities and portions.

−22%
expiry losses (illustrative)

Buy and store better

Review ordering frequency, shelf life, spoilage and expiry.

3
menu items reviewed

Serve and menu better

Use plate-return and unsold-food patterns to review portions, recipes and menu items.

AED 2,140
estimated monthly opportunity

Plan and protect margin

Compare demand patterns, repeated effort and estimated waste cost.

A leaner way to start

Prove the opportunity before committing to a hardware project.

Installed monitoring model

Fixed hardware first

  • Dedicated camera, scale or monitoring station
  • Installation and procurement decision
  • Suitable where automated weighing justifies the setup
Crumbz starting model

Evidence first, hardware later

  • Use existing phones or a shared kitchen device
  • Place QR codes at relevant waste stations
  • Begin with one kitchen
  • Expand only when the evidence is useful
  • Experience the full operating loop free for 36 days
Quick answers

Before the kitchen starts.

  • Staff scan a QR code, photograph discarded food, confirm the food item, quantity range and reason, and continue working. Crumbz groups repeated patterns for management review.

Give Crumbz 36 days. Let your own kitchen data show where the loss is.

Create your admin account, start a free trial, and open the Crumbz admin panel — no payment required to begin.

Begin with one kitchen.

Download on the App Store
What happens next: We create your restaurant and admin login, start a trial, then take you to admin.crumbz.ai to sign in.

By submitting this form, you agree to be contacted about Crumbz onboarding. See our privacy policy.